I have been getting a lot of questions on the fixed income markets and in particular the inverted yield curve here in the United States. Before I dive into the latter, lets recap what is going on at a high level in the global fixed income markets.
NEGATIVE YIELDS
As you have probably read, yields in much of the world are negative. An investor will actually pay the government to borrow the investor’s money for some period of time, typically ranging from 30 days to 30 years. Read that sentence again!
Bloomberg wrote a good story on the mechanics of negative yields, its worth reading.
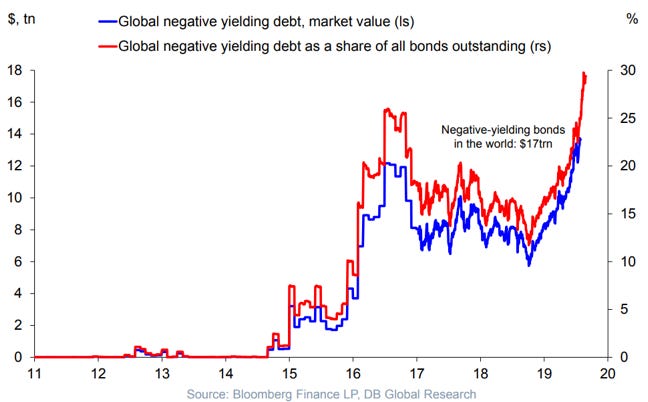
So how big is the market for bonds that don’t pay interest and have a negative yield?Currently the market is at about $17 trillion or about 22% of all debt outstanding. See the chart below.
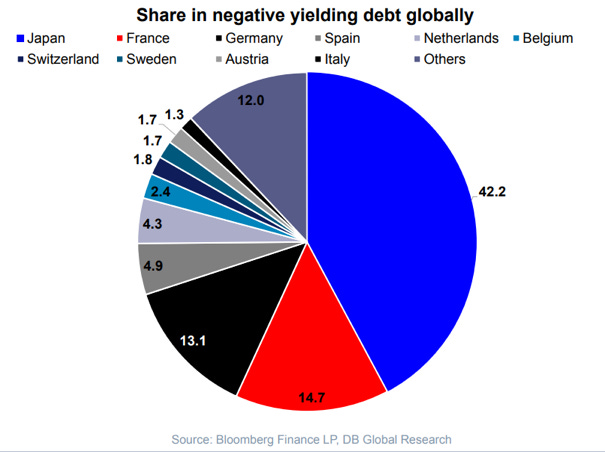
The two largest issuers of negative yielding debt are Japan and members of the European Union. Japan accounts for 42% of all outstanding negative yielding debt and Europe accounts for 46%.
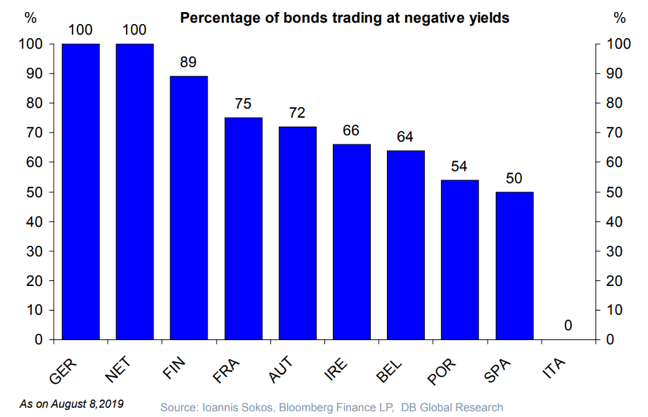
Recently Germany made headlines when it’s entire government yield curve went negative, joining the Netherlands and Japan in this exclusive and dubious club.
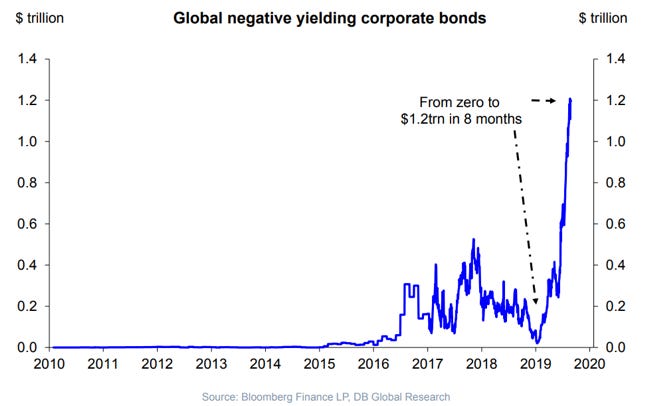
But, it is not just sovereign states that are issuing debt with no yield or a negative yield. Corporate issuers are also getting in on the action, see chart below.
WHO’S THE BUYER
This all begs the question of who on Earth would want to buy negative yielding debt? Not you and certainly not me!
The answer is central banks and pension funds, the latter are often quasi-government entities and are price and yield insensitive. This fits nicely into the ZIRP and QE narrative. Remember at a high level there is a belief that financial repression, i.e. artificially low interest rates, will stimulate economic activity.
However, more recently we are seeing actual asset managers and mutual funds buying negative yielding debt. This is a bit disturbing, but is probably a play to lock in capital gains as yields decline even further / become more negative.

RELATIVE VALUE
There is a massive relative value trade occurring as a result of the central banks efforts to manipulate yield curves to spur economic activity. I think that we are currently in the midst of the Biggest Relative Value Trade in the history of the world. Bigger than anything we have ever seen before.
European and Japanese investors are buying US Treasuries. In fact, Japan just overtook China to regain the top spot of foreign holders of US Treasury bonds.
Below is a graph comparing the United States (purple), European Union / Germany (red) and Japanese (blue) yield curves. It provides a good visual of how much higher yields are in the United States relative to the rest of the world.

The table below breaks out 2 yr yields across various global markets. Earn 1.50% in the United States or lose .25% in Japan or as much as -1.25% in Europe?

Yes, you have foreign exchange risk and interest rate parity theory to contend with, but guess what, interest rate forwards are often mispriced!
INVERTED CURVES
All of the above brings us to the inverted yield curve here in the United States.
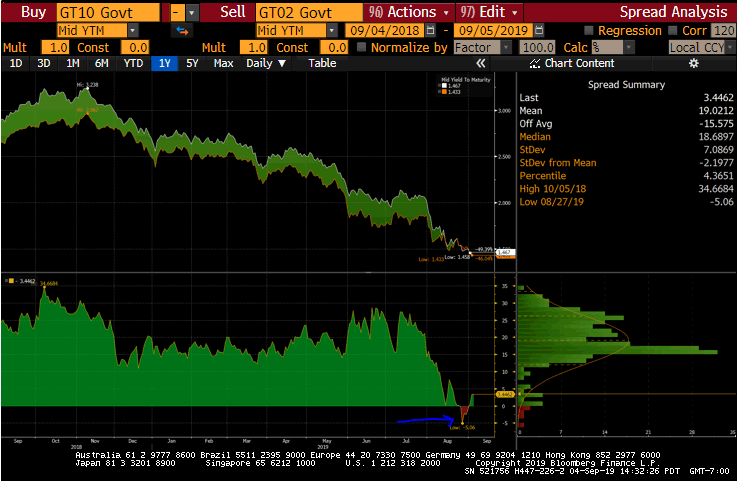
I am old school, so I still look at the 2/10s curve for signals and it was indeed briefly inverted (blue arrow). But only briefly.
The graph below illustrates the difference in yield between the 2yr US Treasury and the 10yr US Treasury. When the 2yr Treasury is higher in yield than the 10yr Treasury the curve is inverted. Currently the curve is NOT inverted, it has a positive slope of about 3 basis points.
My premise is that global investors are driving down yields in the United States, their desire to own US Treasuries is largely driven by the relative value / profits to be gained by investing in higher yielding securities in the US.
Makes sense right?
So, does an inverted yield curve forecast a recession? In the past I would have said yes, no doubt and then our discussion would turn to how long does the curve need to be inverted to produce a reliable signal?
But in today’s world of highly active central banks openly attempting to distort yield curves, I am less certain. I think the lower yields in the United States are more likely a side effect of policy decisions being made in Brussels and Tokyo than evidence of an impending slowdown in the US economy.
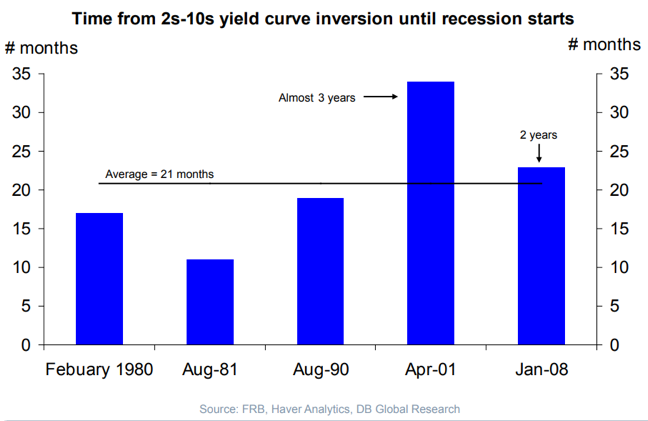
But, even if the curve becomes inverted again and stays inverted long enough to produce a reliable signal it is unlikely that a recession will begin for at least 2 years after the time of inversion (see chart below).
CLOSING THOUGHT
All of the above activity from the Central Banks creates a lot of distortions in global markets. It pushes all investors out the risk curve in search of returns to enable them to meet their obligations. In my seat as a pension fund manager I see this first hand.
This bodes well for venture capital and private equity, both sit on the extremes of the capital markets return curve. If you believe in innovation as a primary driver to economic growth then venture capital is uniquely well positioned to benefit from the current macro environment. I will write more about that in a future letter.
Finally, I spent the weekend in Yosemite with Jenn and the kids, here is my favorite picture from the trip, a shot taken from Sentinel Bridge looking into the Valley with El Capitan on the left. And yes, it was shot with an iPhone and no filters!

If you are interested in startups, you can follow my Angel List Syndicate.
Thanks for reading my letter and and feel free to forward it! - Sean Bill / MacroCrunch

